.webp)
STEEL INDUSTRY ETP CASE STUDY
How a 3,600 KLD Steel Plant ETP Eliminated 99.5% Cyanide & 99.2% Phenol
Industry: Steel Manufacturing (Coke Oven Effluent, HR/CR Plates, Galvanised Sheets, Pipes)
Plant Location: Eastern India | Plant Capacity: 3,600 m³/day (3.6 MLD)
Core Tech: Aeration Tanks, Anoxic Tanks, MBR & RO Recycling
99.5%
Cyanide Degradation (6.5 → 0.031 mg/L)
99.2%
Phenol Reduction (250 → 2.0 mg/L)
94.3%
Thiocyanate Degradation (350 → 20 mg/L)

This steel industry wastewater treatment case study explains how a 3,600 KLD integrated steel plant ETP biologically removed 99.5% cyanide, 99.2% phenol, and 94.3% thiocyanate from toxic coke oven effluent using BactaServe Aerobic and BactaServe Nutrient Removal. The bio-augmentation programme improved biological treatment performance, protected downstream MBR and RO systems, and enabled stable wastewater recycling.
Background & Technical Challenge
Plant Overview
A leading integrated steel manufacturer in Eastern India operates one of the region's largest steel production facilities, manufacturing plate mill plates, hot-rolled (HR) plates and coils, ERW pipes, SW pipes, cold-rolled (CR) sheets and coils, galvanised sheets (GP & GC), and silicon steel sheets. These manufacturing processes generate high-strength coke oven wastewater containing toxic pollutants that require advanced treatment before recycling or discharge.
The company operates a 3,600 KLD Effluent Treatment Plant (ETP) to treat wastewater with typical influent characteristics of COD 1,300–1,800 mg/L, BOD 500–800 mg/L, ammoniacal nitrogen 250–300 mg/L, cyanide up to 6.5 mg/L, thiocyanate up to 350 mg/L, and phenol up to 250 mg/L, making it one of the most challenging industrial effluents to treat biologically.
The treatment facility combines physicochemical pre-treatment, aerobic and anoxic biological processes, Membrane Bioreactor (MBR) technology, and Reverse Osmosis (RO) to remove toxic pollutants and produce treated water suitable for recycling within the plant. To achieve stable treatment performance and protect downstream membrane systems, the plant required a specialised biological solution capable of rapidly degrading cyanide, thiocyanate, and phenolic compounds while maintaining consistent microbial activity under high-strength wastewater conditions.
The Technical Challenge & Risk
High Chemical Toxicity: Influent wastewater contained up to 6.5 ppm cyanide (CN), 350 ppm thiocyanate (SCN), and 250 ppm phenol, creating a highly toxic environment for conventional biological treatment.
Ammonia Spikes: Biological degradation of thiocyanate released additional free ammonia (NH₃-N), pushing total nitrogen concentrations up to ppm and increasing the load on nitrification and denitrification processes.
Low BOD:COD Ratio: A limited biodegradable carbon source constrained biological denitrification, reducing overall nitrogen removal efficiency.
MBR & RO Fouling Risk: Incomplete degradation of cyanide, phenols, and thiocyanate accelerated organic fouling of downstream MBR and RO membranes, leading to reduced membrane performance, increased cleaning frequency, and costly operational downtime.
Need for Stable Biological Treatment: The plant required a specialised bio-augmentation strategy capable of consistently degrading toxic pollutants while protecting downstream treatment units and maintaining stable biological performance.
Treatment Process Flow Diagram
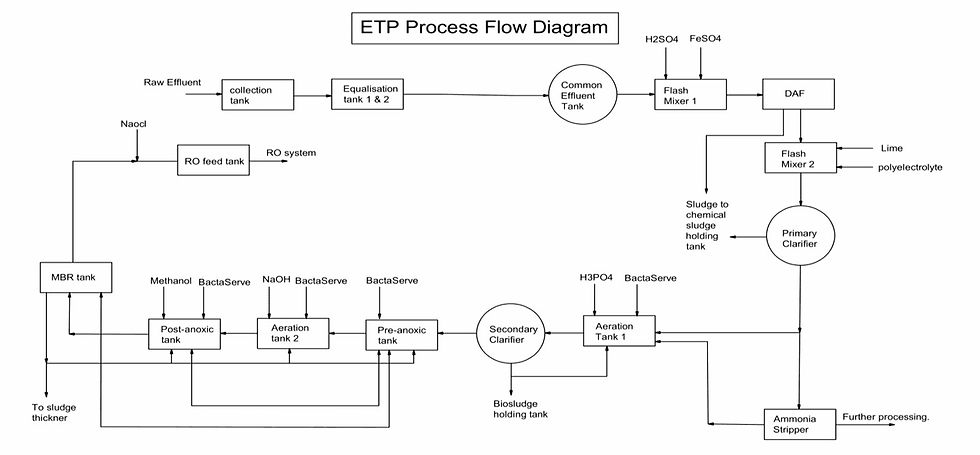
Treatment process flow diagram of the integrated steel plant effluent treatment system showing the treatment sequence and key process units.
The integrated treatment process combines physicochemical, biological, membrane, and tertiary treatment technologies to remove toxic pollutants and produce high-quality recycled water.
Process units mapped based on the actual plant flow: Raw Coke Oven Effluent → Oil & Tar Separation → Equalisation Tank → pH Adjustment → Aeration Tank → Anoxic Tank → Secondary Clarifier → Membrane Bioreactor (MBR) → Reverse Osmosis (RO) → Recycled Water Tank
Process Overview
Oil & Tar Separation: Removes free oil, tar, and floating solids to protect downstream treatment units and improve biological process efficiency.
Equalisation & pH Adjustment: Balances wastewater flow, pollutant concentration, and pH to provide stable operating conditions for biological treatment.
Aerobic Biological Treatment: Specialised bacteria degrade cyanide, phenols, thiocyanate, and biodegradable organic matter while reducing COD and BOD.
Anoxic Biological Treatment: Converts nitrate into nitrogen gas through biological denitrification, helping control the high nitrogen load generated during thiocyanate degradation.
Secondary Clarification: Separates biological sludge from treated wastewater, maintaining stable biomass concentration and improving effluent quality.
Membrane Bioreactor (MBR): Removes fine suspended solids and biomass to produce a low-turbidity effluent while protecting downstream polishing systems.
Reverse Osmosis (RO): Eliminates dissolved salts and residual contaminants, producing high-quality treated water suitable for recycling within the steel plant.
Bio-Augmentation Strategy & Dosing
Why BactaServe™ Aerobic + BactaServe Nutrient Removal Was Selected
To overcome the challenges of treating toxic coke oven wastewater, Amalgam Biotech implemented a customised bio-augmentation programme using BactaServe Aerobic and BactaServe Nutrient Removal. The specialised microbial consortium was designed to rapidly establish a resilient biological population capable of degrading cyanide, thiocyanate, phenols, and other biodegradable organic pollutants under high-strength industrial wastewater conditions.
Unlike conventional biological treatment, the solution enhanced microbial diversity, accelerated pollutant degradation, improved nitrification and denitrification, and maintained stable treatment performance despite fluctuations in toxic loading. This enabled the plant to consistently achieve high removal efficiencies while protecting downstream MBR and RO systems.
Key Benefits
Rapid establishment of specialised pollutant-degrading microbial populations
Efficient biological degradation of cyanide, thiocyanate, and phenolic compounds
Enhanced nitrification and denitrification for high nitrogen wastewater
Improved COD and BOD removal under toxic wastewater conditions
Greater resistance to shock toxic and hydraulic loading
Reduced membrane fouling, lower maintenance requirements, and improved operational stability
Consistent protection of downstream MBR and RO systems
Microbial Strains & Targeting Matrix
The BactaServe bio-augmentation programme combines specialised aerobic bacteria with nutrient-removal microorganisms to biologically degrade toxic contaminants while maintaining a balanced and stable microbial ecosystem throughout the treatment process.
BactaServe Aerobic (Aeration 1)
Target: Thiocyanate, Phenols, COD & BOD
Strains: Paracoccus species & mixed consortia
BactaServe Aerobic (Aeration 1)
Target: Phenol reduction & COD/BOD degradation
Strains: Pseudomonas species & Bacillus species (megaterium, amyloliquefaciens)
BactaServe Aerobic (Aeration 2)
Target: NH₃-N, Nitrification & Nitrate conversion
Strains: Nitrobacter & Nitrosomonas species
BactaServe Nutrient Removal (Anoxic)
Target: Denitrification (NO₃⁻-N → N₂ Gas)
Strains: Thiobacillus species
45-Day Dosing Protocol (3600 KLD)
Timeline Sequence | Aeration Tank 1 (kg/day) | Aeration Tank 2 (kg/day) | Anoxic Tank (kg/day) |
Days 1 – 5 | 10 kg | 5 kg | 7 kg |
Days 6 – 10 | 8 kg | 3 kg | 6 kg |
Days 11 – 20 | 5 kg | 2.5 kg | 5 kg |
Days 21 – 30 | 4 kg | 1.5 kg | 3.5 kg |
Days 31 – 45 | 2 kg | 1 kg | 2 kg |
Table 1: Inlet Parameters – Routine
Parameter | Values (mg/Lit.) |
pH | 9 – 9.5 |
Colour (Hazen) | < 20 |
Temperature (°C) | 35 – 38 |
Total Suspended Solids (TSS) | 20 – 30 |
Total Dissolved Solids (TDS) | 4200 – 4500 |
Conductivity (µS/cm) | 6700 |
Oil & Grease | < 5 |
Iron | 3 – 5 |
Total Chromium | < 0.05 |
Silica | 13.6 – 14.14 |
Fluorides | < 8 |
Table 2: Inlet Parameters – Critical
Parameter | Values (mg/Lit.) |
Chemical Oxygen Demand (COD) | 1300 – 1800 |
Biological Oxygen Demand (BOD) | 500 – 800 |
Ammoniacal Nitrogen (NH₃-N) | 250 – 300 |
Nitrate (NO₃) | 25 – 30 |
Total Kjeldahl Nitrogen (TKN) (As provided) | 150 – 200 |
Cyanide (CN) | 2.5 – 6.5 |
Thiocyanate (SCN) | 300 – 350 |
Phenol (C₆H₅OH) | 150 – 250 |
*Dosing schedule is based on this plant case study and may vary depending on plant operating conditions and site-specific factors.
Performance Results & Analytics
Key Metrics Achieved
99.5% Cyanide Removal: Cyanide concentration decreased from 6.5 mg/L to <0.03 mg/L, ensuring effective detoxification before downstream treatment.
94.3% Thiocyanate Removal: Thiocyanate concentration reduced from 350 mg/L to 20 mg/L, significantly lowering toxicity and sulphur loading.
99.2% Phenol Removal: Phenol concentration declined from 250 mg/L to 2 mg/L, substantially reducing wastewater toxicity and improving biological treatment performance.
Stable Nitrogen Removal: Despite thiocyanate degradation increasing total nitrogen concentrations to approximately 400 mg/L, the biological system maintained effective nitrification and denitrification for stable treatment performance.
Improved Biological Stability: The specialised microbial consortium maintained consistent pollutant degradation under fluctuating wastewater characteristics, reducing process upsets and improving overall ETP reliability.
Perfomance Comparison
Parameter | Inlet Value | MBR Outlet |
Cyanide (CN) | 6.5 mg/L | 0.031 mg/L |
Phenol (C₆H₅OH) | 250 mg/L | 2.0 mg/L |
Thiocyanate (SCN) | 350 mg/L | 20.0 mg/L |
Biological Oxygen (BOD) | 280 mg/L | 8.0 mg/L |
Chemical Oxygen (COD) | 1,376 mg/L | 104.0 mg/L |
Ammoniacal Nitrogen (NH₃-N) | 300 mg/L | 44.8 mg/L |
Total Kjeldahl Nitrogen (TKN) | 200 mg/L | 45.0 mg/L |
Nitrate (NO₃) | 30 mg/L | 15.47 mg/L |
*Data captured post-treatment at MBR outlet prior to RO feed.


The biological treatment system effectively removed cyanide, phenol, and thiocyanate from coke oven wastewater, protecting downstream MBR and RO units and enabling reliable water recycling.
Client Feedback: Cyanide, Thiocyanate & Phenol Removal
“Our 3,600 KLD steel plant ETP was struggling with coke oven wastewater containing 250 ppm phenol, 350 ppm thiocyanate and cyanide spikes. Amalgam’s bioaugmentation treatment achieved 99.5% cyanide removal and 99.2% phenol removal. This helped protect our MBR membranes and allowed us to continue recycling treated water through the RO system.”
Chief Engineer
ETP & Utilities, Integrated Steel Facility, Eastern India
⭐⭐⭐⭐⭐
Ready to Solve Complex Effluent Toxicity Issues?
Let our bio-engineers analyze your coke oven or chemical effluent parameters to design a tailored strain-selection and dosing protocol.
Step 1: Share your process details and treatment objectives.
Step 2: Our engineers assess your system and operating conditions.
Step 3: Receive a tailored solution and implementation plan.
Frequently Asked Questions
Q1: How did BactaServe achieve a 99.5% cyanide and 99.2% phenol removal in a 3,600 KLD steel ETP?
BactaServe Aerobic and Nutrient Removal introduced specialised bacterial consortia (Paracoccus, Pseudomonas, and Bacillus species) that biologically oxidised toxic coke oven compounds. In a 3,600 KLD steel plant, the system reduced cyanide from 6.5 mg/L to 0.031 mg/L and phenol from 250 mg/L to 2.0 mg/L.
Performance Highlights:
Target Waste Stream: Highly toxic coke oven wastewater from plate mills, HR/CR coils, and galvanised sheet manufacturing.
Thiocyanate Breakdown: Reduced thiocyanate (SCN) by 94.3%, from 350 mg/L to 20 mg/L.
COD/BOD Reduction: Reduced COD from 1,376 mg/L to 104 mg/L and BOD from 280 mg/L to 8 mg/L at the MBR outlet.
Q2: Why does thiocyanate degradation complicate nitrogen removal in coke oven wastewater treatment?
The biological breakdown of thiocyanate releases free ammonia, increasing the total nitrogen load, which can reach 400 mg/L. This requires a bio-augmentation programme using nitrifying bacteria (Nitrosomonas and Nitrobacter) in aeration tanks and denitrifying bacteria (Thiobacillus) in anoxic tanks to prevent ammonia build-up.
Process Breakdown:
Thiocyanate Breakdown: SCN⁻ → NH₃ + SO₄²⁻ + CO₂, releasing additional ammonia into the aeration tank.
Nitrification Stage: Converts ammonia into nitrate (NO₃⁻).
Denitrification Stage: Converts nitrate into nitrogen gas (N₂), helping maintain stable treatment even with low BOD:COD ratios.
Q3: How does bio-augmentation protect downstream MBR and RO membranes in steel plant ETPs?
If cyanide, phenols, and thiocyanate are not fully removed, they can cause severe organic fouling and irreversible biofouling of Membrane Bioreactor (MBR) and Reverse Osmosis (RO) membranes. BactaServe breaks down these complex compounds during biological treatment, helping maintain membrane performance and extend cleaning intervals.
Operational Benefits:
Lower CIP Frequency: Reduces the need for Clean-In-Place (CIP) chemical cleaning of MBR and RO systems.
Protects RO Membranes: Helps prevent toxic compounds from damaging expensive spiral-wound RO membranes.
Supports Water Recycling: Produces high-quality RO feed suitable for Zero Liquid Discharge (ZLD) water reuse in steel manufacturing.
Q4: What specific bacterial strains are included in the BactaServe Coke Oven bio-augmentation protocol?
The BactaServe protocol combines Paracoccus and Pseudomonas species for thiocyanate and phenol removal, Bacillus species (megaterium and amyloliquefaciens) for high COD reduction, Nitrosomonas and Nitrobacter for ammonia-to-nitrate conversion, and Thiobacillus species in anoxic tanks for effective denitrification.
Targeting Matrix:
Aeration Tank 1: Paracoccus, Pseudomonas, and Bacillus for phenol, SCN, and COD removal.
Aeration Tank 2: Nitrosomonas and Nitrobacter for ammoniacal nitrogen conversion.
Anoxic Tank: Thiobacillus for converting nitrate into nitrogen gas.
Q5: What was the 45-day dosing protocol for stabilising the 3,600 KLD coke oven ETP?
The 45-day programme used a phased dosing schedule across three treatment tanks: Aeration Tank 1 received 10 kg/day, reducing to 2 kg/day; Aeration Tank 2 received 5 kg/day, reducing to 1 kg/day; and the Anoxic Tank received 7 kg/day, reducing to 2 kg/day. This helped establish a strong and stable microbial population.
Dosing Progression:
Days 1 to 5 (Acclimation): High initial dosing of 22 kg/day across all tanks to establish the bacterial population.
Days 6 to 20 (Stabilisation): Gradual reduction in dosing while maintaining microbial growth and reducing toxic pollutants.
Days 21 to 45 (Maintenance): Low maintenance dosing of 5 kg/day across all tanks to maintain long-term biological stability and resistance to shock loads.
Q6: What process flow configuration was used to treat and recycle 3.6 MLD of coke oven wastewater?
The 3600 KLD treatment process includes Oil & Tar Separation, Equalisation, pH Adjustment, two-stage Aerobic Biological Treatment, Anoxic Biological Treatment, Secondary Clarification, Membrane Bioreactor (MBR), and Reverse Osmosis (RO) for complete water recycling.
Pre-treatment Function: The Oil & Tar Separation stage removes free hydrocarbons before biological treatment, helping protect the microbial culture and maintain efficient oxygen transfer in the aeration tanks.

Written by Ashutosh Vadanagekar
Technical Director, Amalgam Biotech
Ashutosh Vadanagekar has over 22 years of experience in water and wastewater treatment, with expertise in process design and bioculture technology. He develops and implements eco-friendly biological treatment solutions for ETPs and STPs across industries, addressing challenges such as high COD and BOD, ammonia, FOG, odour and biological process instability. He also contributes technical expertise and practical insights to Amalgam Biotech’s wastewater treatment case studies. Connect on LinkedIn